Bureau of Meteorology
Helping climate-critical organisations actually use the data they need
Australia's water, road and waste infrastructure is under increasing pressure from climate change. The organisations managing that infrastructure need better data to plan ahead — but having data and being able to use it are two very different things. We partnered with the Bureau of Meteorology to understand what was getting in the way of adoption, and to design a digital platform that would make their landscape water balance data accessible, trustworthy and genuinely useful.
Outcomes
-
A strategic vision for a community-driven data platform
-
Validated prototypes tested with users across 4 states and 14 organisations
-
A design and development roadmap to guide ongoing delivery
-
Reusable research processes and design capability the Bureau could build on for future products
A data challenge shaped by climate change
The people responsible for safe water, usable roads, recreational waterways and other critical infrastructure are making decisions against a shifting climate baseline. To plan well, they need accurate data on soil moisture, surface runoff and evapotranspiration — the forces shaping how land and water systems behave over time.
Scientists at the Bureau of Meteorology have been developing exactly this kind of data. Their landscape water balance dataset brings together global climate models, forecasts and observations to provide nationally consistent spatial data — spanning 100 years into the past and 100 years into the future. The challenge wasn't the science. It was making sure the right people could find, understand and confidently use it.
Understanding what gets in the way of adoption
We worked alongside the Bureau's User Centred Design team and their scientists through an iterative research and design process across 4 states, 14 organisations and more than 40 people.
What we heard was clear: adopting new datasets is hard. People struggled to understand the science behind the data, assess its relevance, or know whether they were using it correctly. Without that confidence, they risked either ignoring the data entirely — or applying it in ways that could lead to poor decisions.
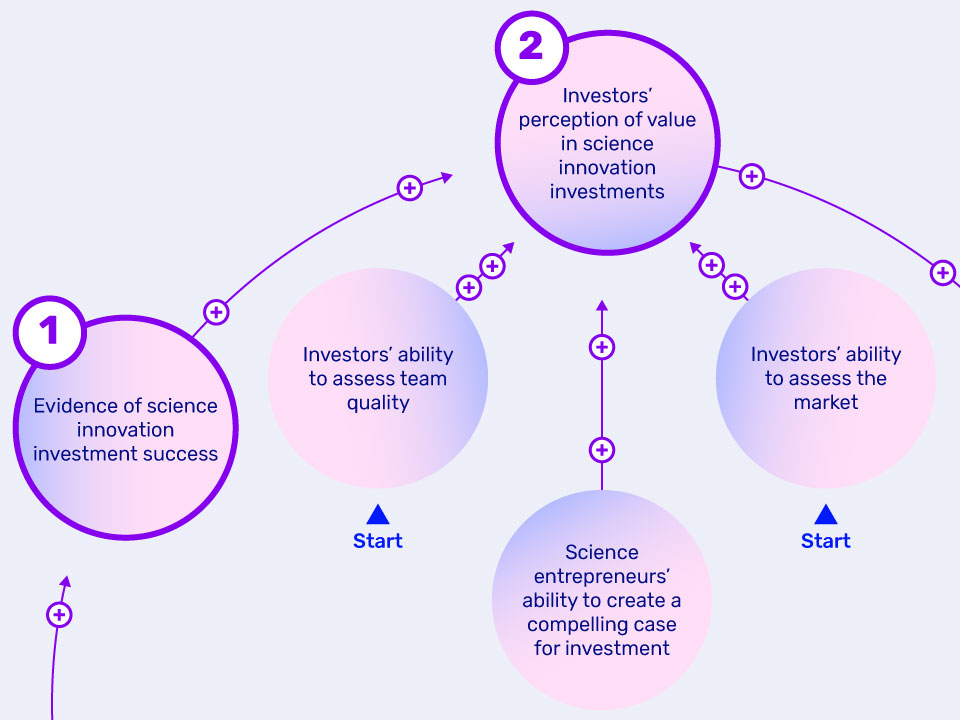
Through our research, we identified three distinct modes people operated in when engaging with new data — we called them "the tourist," "the explorer" and "the local." Each mode came with different needs and different barriers. Designing for all three gave us a way to connect people to the data in ways that actually made sense for how they worked.

A diagram representing the different modes of investigating data and the steps organisations go through to adopt new data sets into their work flows.
Designing a platform built around trust and understanding
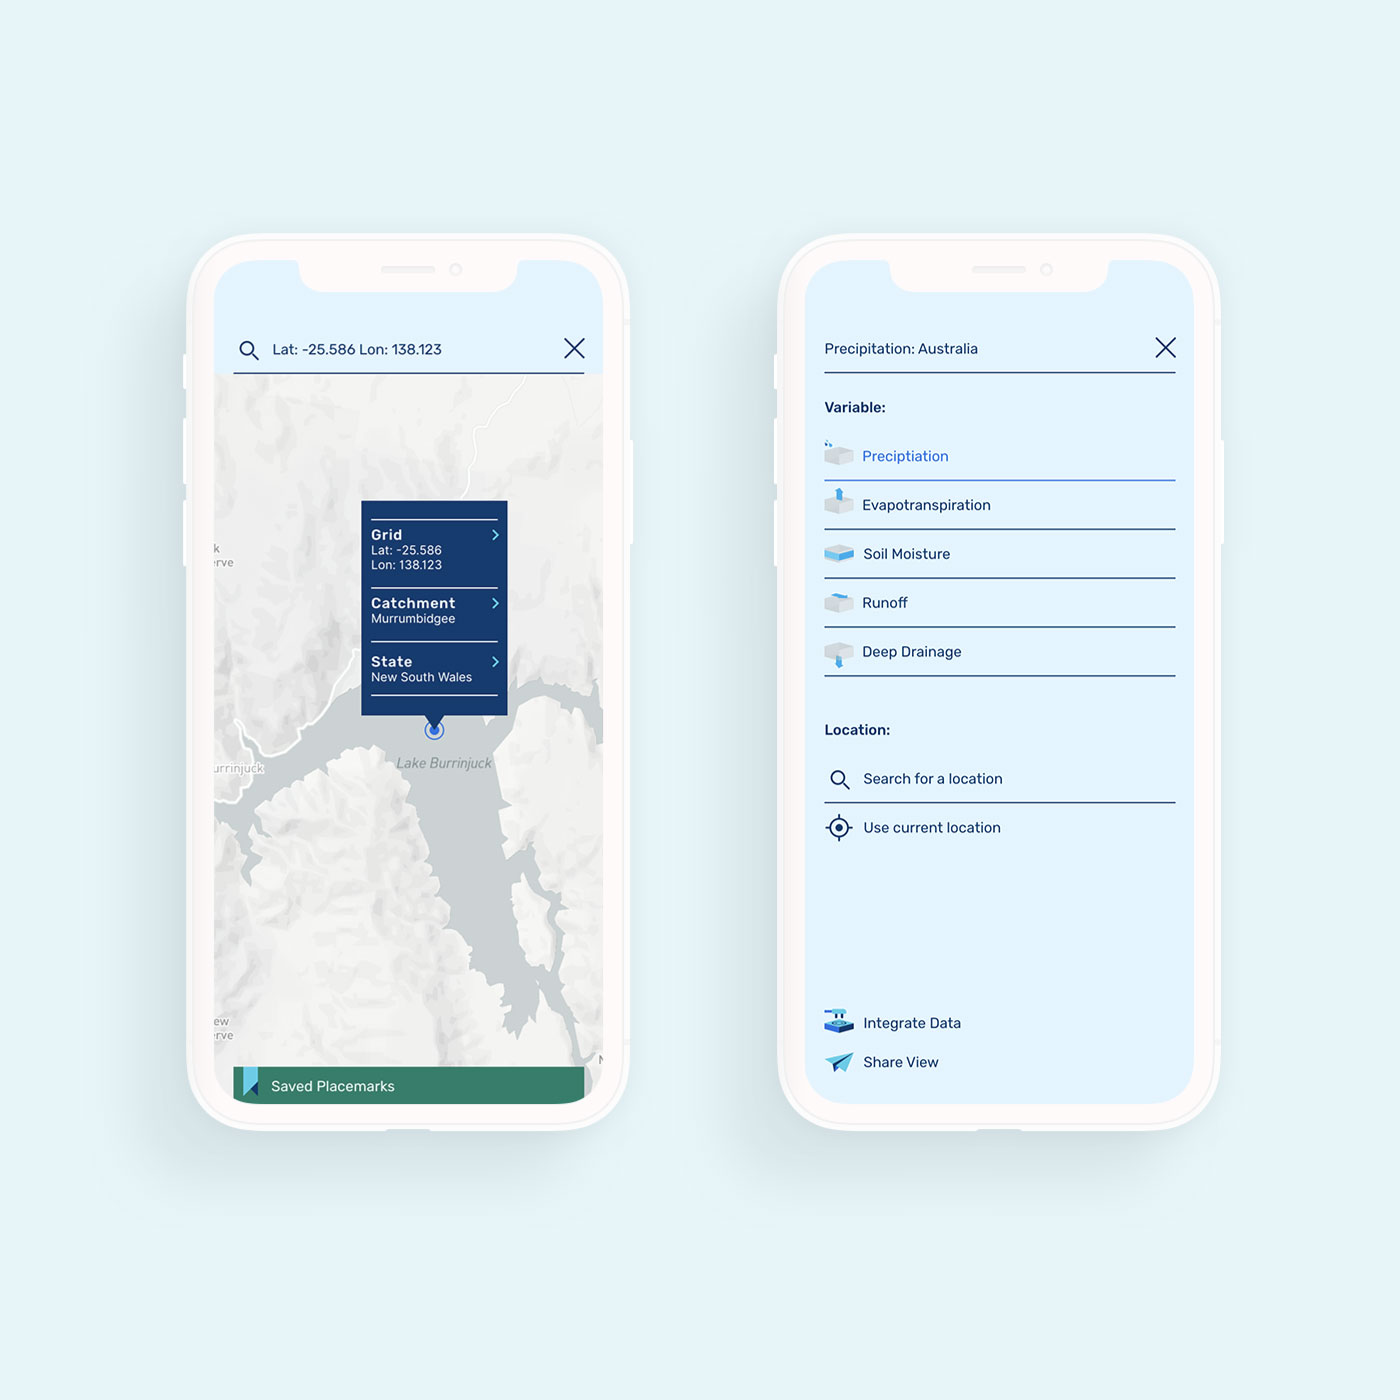
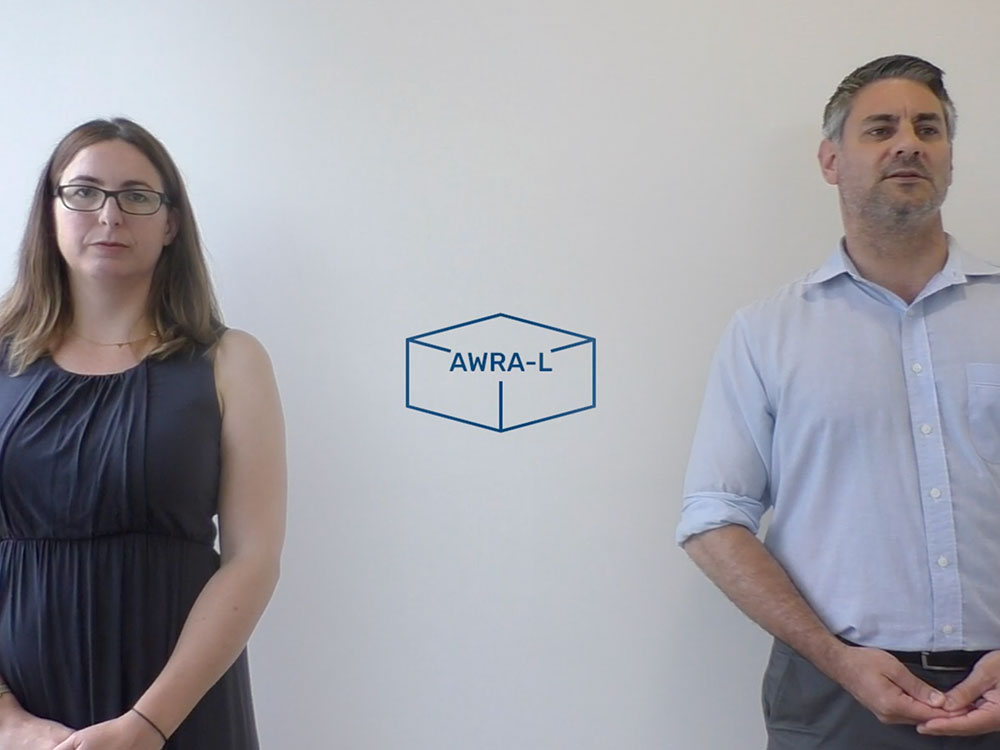
We designed a vision for a digital experience that went well beyond a data download portal. Instead, we created a community data hub — a place that brought together science, data visualisations, case studies, webinars, tutorial videos and direct access to experts. The goal was to build the understanding and confidence that drives real adoption.
We prototyped and tested throughout the process, validating messaging, data visualisations and community engagement strategies directly with the scientific community. By the end, the Bureau had a clear platform vision, validated prototypes, and the confidence to move forward with development.
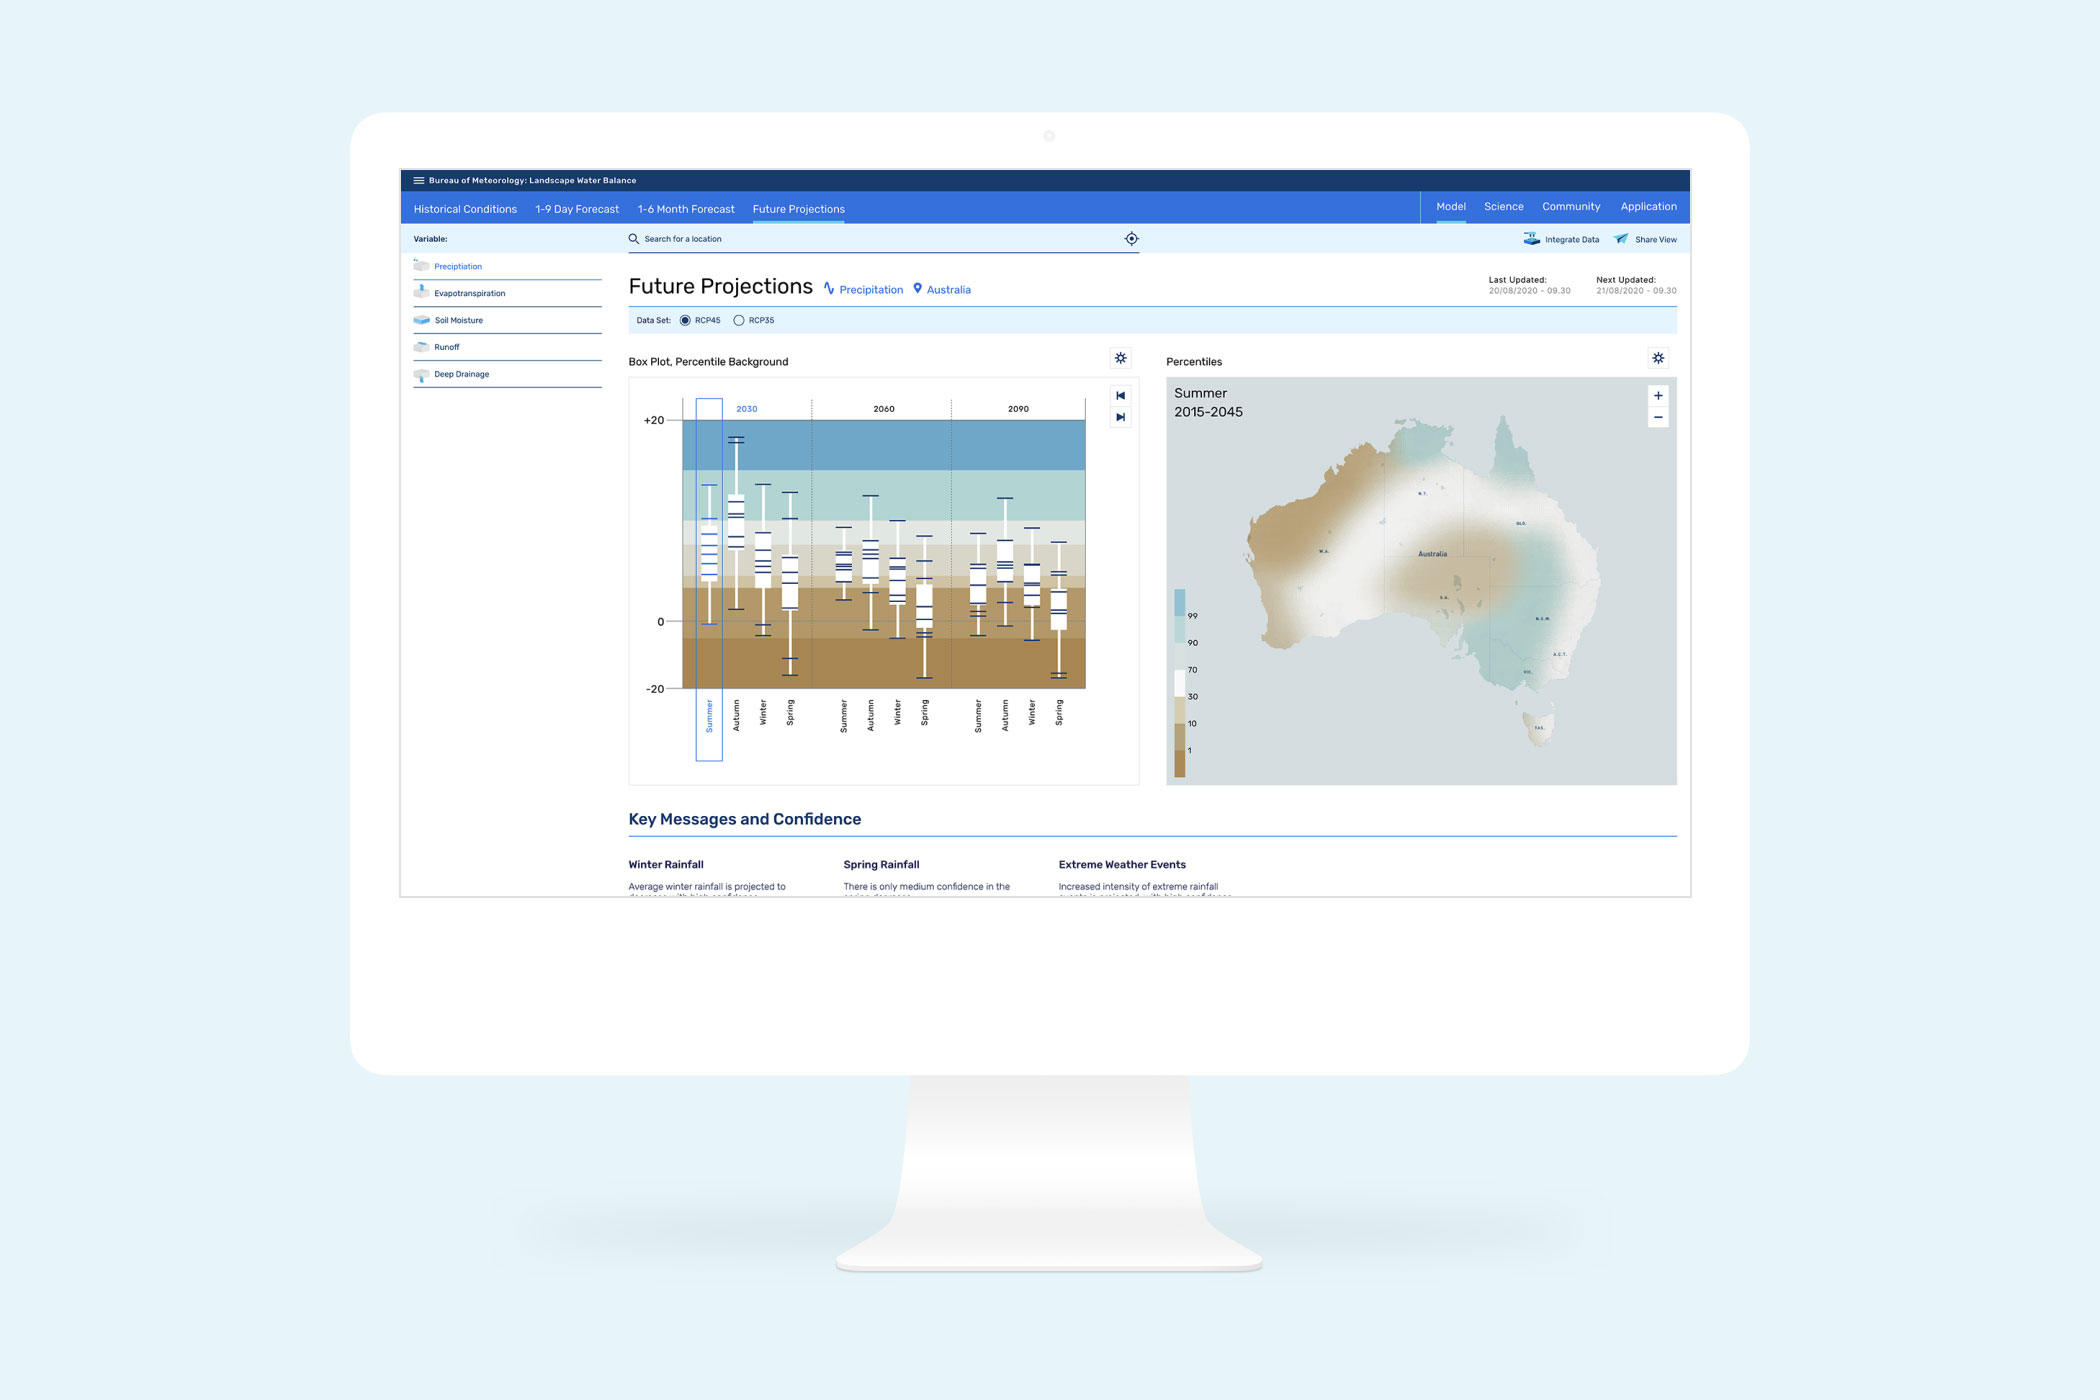
The user interface designed to create the future vision for the Bureau of Meteorology's landscape water balance products.
Thanks again for exceeding our expectations. We're really excited to continue through with pre-launch comms, engagement and building the new product.
— Chantal Donnelly, Bureau of Meteorology
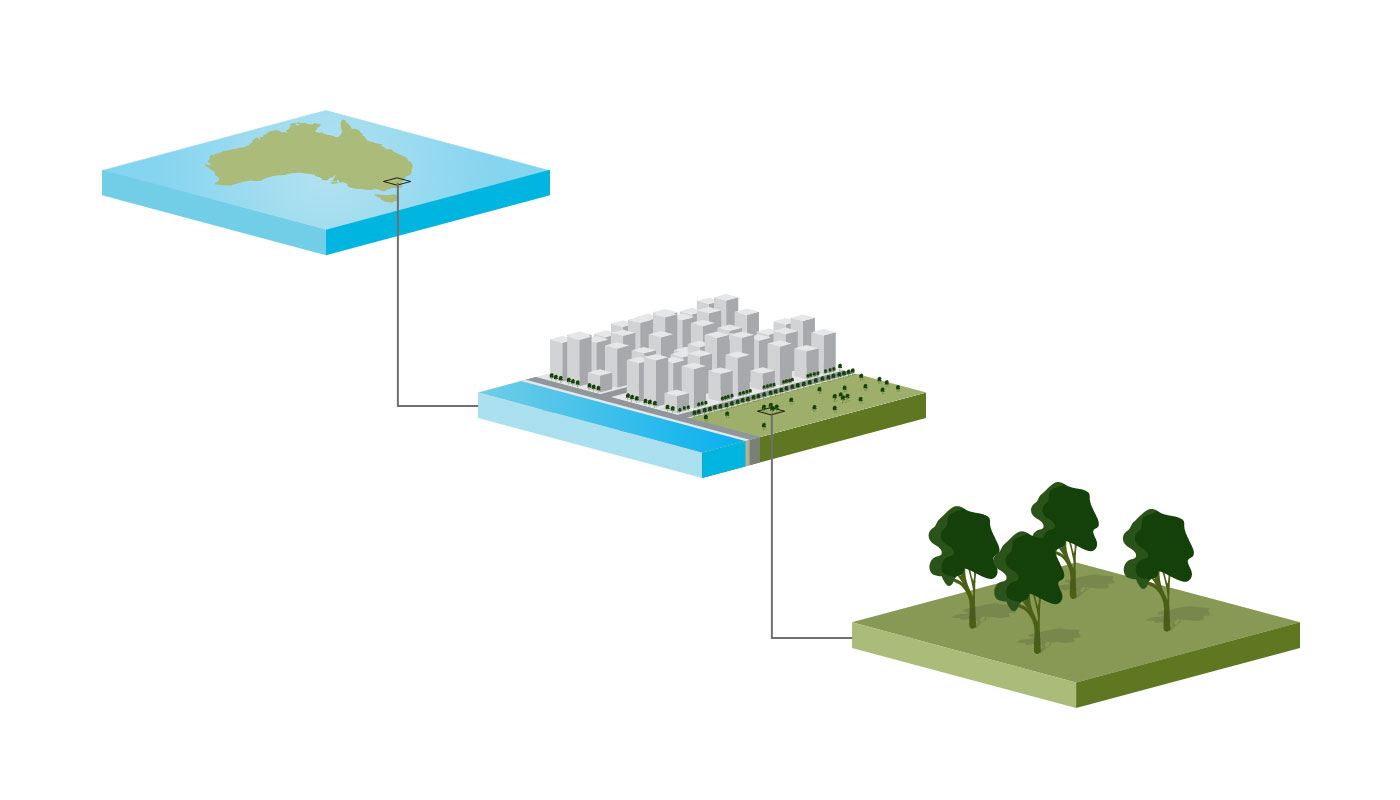
An illustration showing how the gridded data system worked. It was used as part of a product primer that was sent to the key organisations that will use and benefit from the data.